A farmer has 40 metres of fencing and wants a rectangular pen against a long wall, so only
three sides need fencing. How large can the pen be? Before we can answer, we need a precise
way to say how the area depends on the width. Each width gives exactly one area, some
widths make no sense at all (a negative width, or one that uses more than 40 metres of
fence), and only some areas can actually occur.
Those three ingredients — a rule, the inputs it accepts and the outputs it produces — are
what a function is. Almost everything in calculus is about functions: limits describe how
their values behave, derivatives measure how fast they change, and integrals add up their
values. This page fixes the vocabulary that the rest of the course uses, and in particular
the exact meaning of “increasing”, which later results depend on.
Think of a function as a machine: you feed it an input, and it returns exactly one
output. The same input always gives the same output. Different inputs may give the same
output.
In words. Every allowed input gets an output, and never more than one. The function is
f; the number f(x) is its value at one input x. The graph is the curve y=f(x): the
point above (or below) each input x at height f(x).
Example.f:R→R, f(x)=x2, is a function: each real x has exactly one
square. Different inputs can share a value (f(−2)=f(2)=4); that is allowed.
Non-example. Assign to each x∈R the real numbers y with y2=x. This is not
a function from R to R, and it fails in both ways: x=4 gets two numbers, 2 and
-2, and x=−1 gets none.
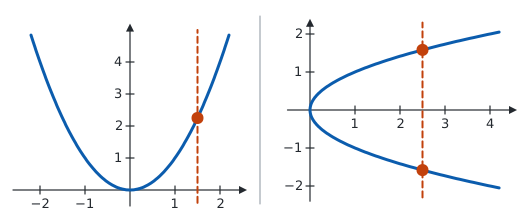
Because each x has only one value, a vertical line x=c meets the graph of a function at
most once: at the point (c,f(c)) if c is an allowed input, and nowhere otherwise. This is
the vertical line test: a curve in the plane is the graph of a function of x exactly when
no vertical line meets it twice (Figure 1).
Figure 1:The vertical line test. Left: the graph of y=x2; every vertical line meets it exactly
once. Right: the curve y2=x of the non-example; the vertical line x=2.5 meets it twice,
so it is not the graph of a function of x.
The set {f(x):x∈domf} is written in set-builder notation, and most domains and
ranges below are intervals or unions of intervals; both are introduced in
Real Numbers and Intervals.
In words. The domain is what you may put in; the range is what actually comes out. The
codomain is only a set that is promised to contain every value, and it may be larger than
the range. To find the range you must show two things: every value f(x) lies in the set
you claim, and every element of that set is a value f(x) for some x.
Example. For f(x)=x−1, the square root needs x−1≥0, so
domf=[1,∞). Every square root is ≥0, and each y≥0 is the value at
x=y2+1, because y2=y for y≥0
(see the remark on square roots). So ranf=[0,∞).
Non-example. For g:R→R, g(x)=x2, the codomain is R, but the range is
not: -1 is not in rang, because no real x has x2=−1. Here rang=[0,∞).
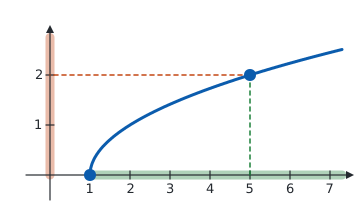
Reading a graph. The domain is the shadow of the graph on the x-axis: the set of x
that have a point of the graph directly above or below them. The range is the shadow on the
y-axis: the set of heights that the graph reaches
(Figure 2). A sketch suggests the domain and range; the
algebra above confirms them.
Figure 2:Domain and range as shadows, for f(x)=x−1. The shadow of the graph on the
x-axis is domf=[1,∞), and its shadow on the y-axis is ranf=[0,∞).
The point (5,2) of the graph casts 5 into the domain and 2=f(5) into the range.
Sketching a graph. For a first sketch, find the domain, compute a few values (including
any points where the formula changes, and where the graph crosses an axis), plot them, and
join them in order of increasing x, leaving gaps where x is not in the domain. Where the
formula changes, compare the heights that the two pieces give there before you join across
that point: if they differ, the graph jumps, and no segment is drawn across the jump. For
example, the function that is 0 for x<0 and 1 for x≥0 has domain R, but its
graph is two horizontal pieces, with no segment from (−1,0) to (0,1).
Two kinds of shape recur throughout calculus. Some graphs look the same after a reflection:
the graph of y=x2 is unchanged by reflection in the y-axis. Some functions only ever go
up (or only ever go down) as x moves to the right. Both properties save work: a symmetric
graph needs to be sketched only for x≥0, and a function that always goes up (one that
is strictly increasing, in the words of the definition below) takes each value at most
once.
In words. An even function takes the same value at x and at −x, so its graph is
symmetric under reflection in the y-axis. An odd function takes opposite values at x and
−x, so its graph is symmetric under a half-turn about the origin: if (x,y) is on the
graph, so is (−x,−y). Both need a domain that is symmetric about 0, so a function whose
domain is not symmetric is neither even nor odd. The condition on the values must hold for
everyx in the domain; one x where it fails is enough to show that a function is not
even (or not odd).
Example.x↦x4−3x2 is even and x↦x3 is odd. The names come from
these examples: a polynomial with only even powers of x is even, and one with only odd
powers is odd.
Non-example.f(x)=x2+x is neither even nor odd: f(1)=2 and f(−1)=0, so
f(−1)=f(1) and f(−1)=−f(1). Most functions are neither even nor odd.
In words. Increasing means “never goes down” as you move right through S; strictly
increasing means “always goes up”. A strictly increasing function is increasing, but not
the other way round: a function that is increasing may stay level for a while. The
definition compares any two points of S, not just neighbouring ones.
Example.f(x)=2x+1 is strictly increasing on R: if x1<x2, then
2x1+1<2x2+1. A constant function on a set S with at least two points is both
increasing and decreasing on S, but neither strictly increasing nor strictly decreasing on
S. (On a set with only one point there are no x1<x2 to compare, so every function is
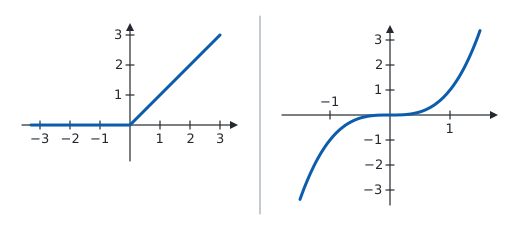
strictly increasing and strictly decreasing there.) The function
is increasing on R but not strictly increasing, because g(−2)=g(−1)=0
(Figure 3).
Figure 3:Left: the function g above is increasing on R but not strictly increasing: it stays level
for x<0. Right: x↦x3 is strictly increasing on R
(Exercise 13 proves it). Its graph is very flat near 0, but no two
points of it are at the same height.
Non-example.h(x)=x2 is not monotone on R: −1<0 with h(−1)>h(0), but
0<1 with h(0)<h(1). It is strictly decreasing on (−∞,0] and strictly
increasing on [0,∞), which is why we always say where a function is increasing.
Definition 1 speaks of a rule, which is not a precise mathematical object. The
standard way to make it precise is to identify a function with its graph. A function from
A to B is a subset G⊆A×B of ordered pairs such that
where ∃! means “there exists exactly one”. The value f(x) is that unique y. With
this definition a function is its set of input–output pairs, and the vertical line test
is just the condition “exactly one y for each x” drawn in the plane.
When are two functions equal?
Two functions f and g are equal when domf=domg and f(x)=g(x) for every x in
that common domain. The domain is part of the function, not an afterthought:
x↦x+1 on R and x↦x−1x2−1 (natural domain) are
different functions: one is defined at 1 and the other is not.
x↦x2 on R is not monotone, but the “same” formula on [0,∞) is strictly
increasing. Restricting the domain in this way is how inverse functions such as x
are obtained later in the course.
Some books also count the codomain as part of a function, so that x↦x2 as a map
R→R and as a map R→[0,∞) are different. Nothing in this course depends on
that distinction.
A function f:A→B assigns to each x∈Aexactly one value f(x); its graph
is the set of points (x,f(x)), and no vertical line meets it twice.
domf is the set of inputs; ranf={f(x):x∈domf} is the set of values. A
formula with no stated domain has its natural domain. To find a range, show both inclusions.
In a model, the domain comes from the situation, not only from the formula.
Even means that domf is symmetric about 0 and f(−x)=f(x) (mirror symmetry in
the y-axis); odd means that domf is symmetric about 0 and f(−x)=−f(x)
(half-turn symmetry about the origin). A function whose domain is not symmetric is
neither.
Increasing on S: x1<x2 implies f(x1)≤f(x2). Strictly increasing:
x1<x2 implies f(x1)<f(x2). Always say on which set.
The quotient is defined unless the denominator is zero. Since x2−4=(x−2)(x+2), it
is zero exactly when x=2 or x=−2. A zero numerator (at x=−1) is no problem:
g(−1)=−30=0. So
domg=(−∞,−2)∪(−2,2)∪(2,∞), all real numbers except ±2.
The domain R is symmetric about 0. We have f(1)=1−1+1=1 and
f(−1)=−1+1+1=1, so f(−1)=1=−1=−f(1). The condition of
Definition 3 fails at x=1, so f is not odd. (Without the constant term,
x5−x3 would be odd.)
The vertical line x=0 meets the circle at (0,1) and at (0,−1), because both satisfy
02+y2=1. A function assigns only one value to x=0, so the circle is not the graph
of a function of x. Its upper half is: it is the graph of x↦1−x2 on
[−1,1].
Cutting a square of side x from each corner leaves a base of side 30−2x cm, and the flaps
give a height of x cm. A box needs x>0 (otherwise nothing is folded up) and
30−2x>0, that is, x<15 (otherwise there is no base). So the possible values form the
interval (0,15).
The base is a square of side 30−2x cm, so its area is (30−2x)2 cm², and the height is
x cm. Hence V(x)=x(30−2x)2 cm³, with domain (0,15) from
Exercise 5. For example, x=5 gives a box 20 cm by 20 cm by
5 cm, of volume V(5)=5⋅202=2000 cm³.
The domain is all x=1. A number y is in rang exactly when the equation
x−12x+1=y has a solution x=1. For x=1 we may multiply by x−1,
so the equation is equivalent to
Take x1=0 and x2=1 in [0,∞). Then x1<x2, but f(0)=0>−1=f(1),
so the condition of Definition 4 fails. Completing the square,
f(x)=(x−1)2−1, shows the full picture: f is strictly decreasing on [0,1] and
strictly increasing on [1,∞).
Sketch. For x<0 the graph is the line y=−x, rising to the left and approaching
the origin from the left. For 0≤x≤3 it is the parabola
y=(x−1)2−1, from (0,0) down to its lowest point (1,−1) and up to (3,3). The
two pieces meet at the origin.
Left piece. For x<0 the values −x are positive, and every y>0 is taken (at
x=−y). So this piece contributes (0,∞).
Right piece. Let 0≤x≤3, so that −1≤x−1≤2. A square is never
negative, so (x−1)2≥0. For the upper bound we cannot square the two inequalities
term by term, because x−1 may be negative; we split into two cases.
If x−1≥0: multiplying x−1≤2 by x−1≥0 gives
(x−1)2≤2(x−1), and multiplying x−1≤2 by 2>0 gives
2(x−1)≤4, so (x−1)2≤4.
If x−1<0: multiplying −1≤x−1 by the negative number x−1 reverses the
inequality and gives (x−1)2≤−(x−1), and multiplying −1≤x−1 by -1
gives −(x−1)≤1, so (x−1)2≤1≤4.
In both cases 0≤(x−1)2≤4, so −1≤f(x)≤3. Conversely, let
y∈[−1,3]. Then y+1≥0 has a square root s=y+1≥0
(the remark on square roots), and
s≤2: if s>2, then s2>2s>4, but s2=y+1≤4. So x=1+s lies in
[1,3], and f(x)=s2−1=y. So this piece contributes [−1,3].
Together.ranf=[−1,3]∪(0,∞)=[−1,∞), with the smallest value
f(1)=−1.
We show that x2−x1>0 by rationalising: multiplying and dividing by
x2+x1 turns the difference of the roots into x2−x1. Recall that each
x≥0 has exactly one square root x≥0, and (x)2=x
(the remark on square roots).
Let 0≤x1<x2. Then x2>0, so x2>0 (since x2=0 would give
x2=02=0), and x1≥0; hence x2+x1>0. Using (a−b)(a+b)=a2−b2,
The numerator and the denominator are both positive, so x1<x2. As
x1<x2 in [0,∞) were arbitrary, the square root is strictly increasing on
[0,∞).
We put x=0 in the condition that defines an odd function. Since f is odd and
0∈domf, the condition f(−x)=−f(x) holds for x=0. As
−0=0, it says f(0)=−f(0), so 2f(0)=0 and f(0)=0.
The function x↦x3+1 has domain R, which contains 0, and its value there is
03+1=1=0. If it were odd, its value at 0 would be 0; so it is not odd.
The first factor is positive. The second is a sum of two squares, so it is ≥0, and it is
0 only if both squares are 0: x2=0 and x1=−2x2=0. That would give
x1=x2, which is impossible. So the second factor is positive too, and
x23−x13>0, that is, x13<x23.
We first show that g and h are forced (so there is at most one pair), then that the forced
pair works.
At most one pair. Suppose g is even, h is odd and f(x)=g(x)+h(x) for every x.
Applying this at −x gives f(−x)=g(−x)+h(−x)=g(x)−h(x). Adding and subtracting the
two equations,